Thirty-four years.
One trend.
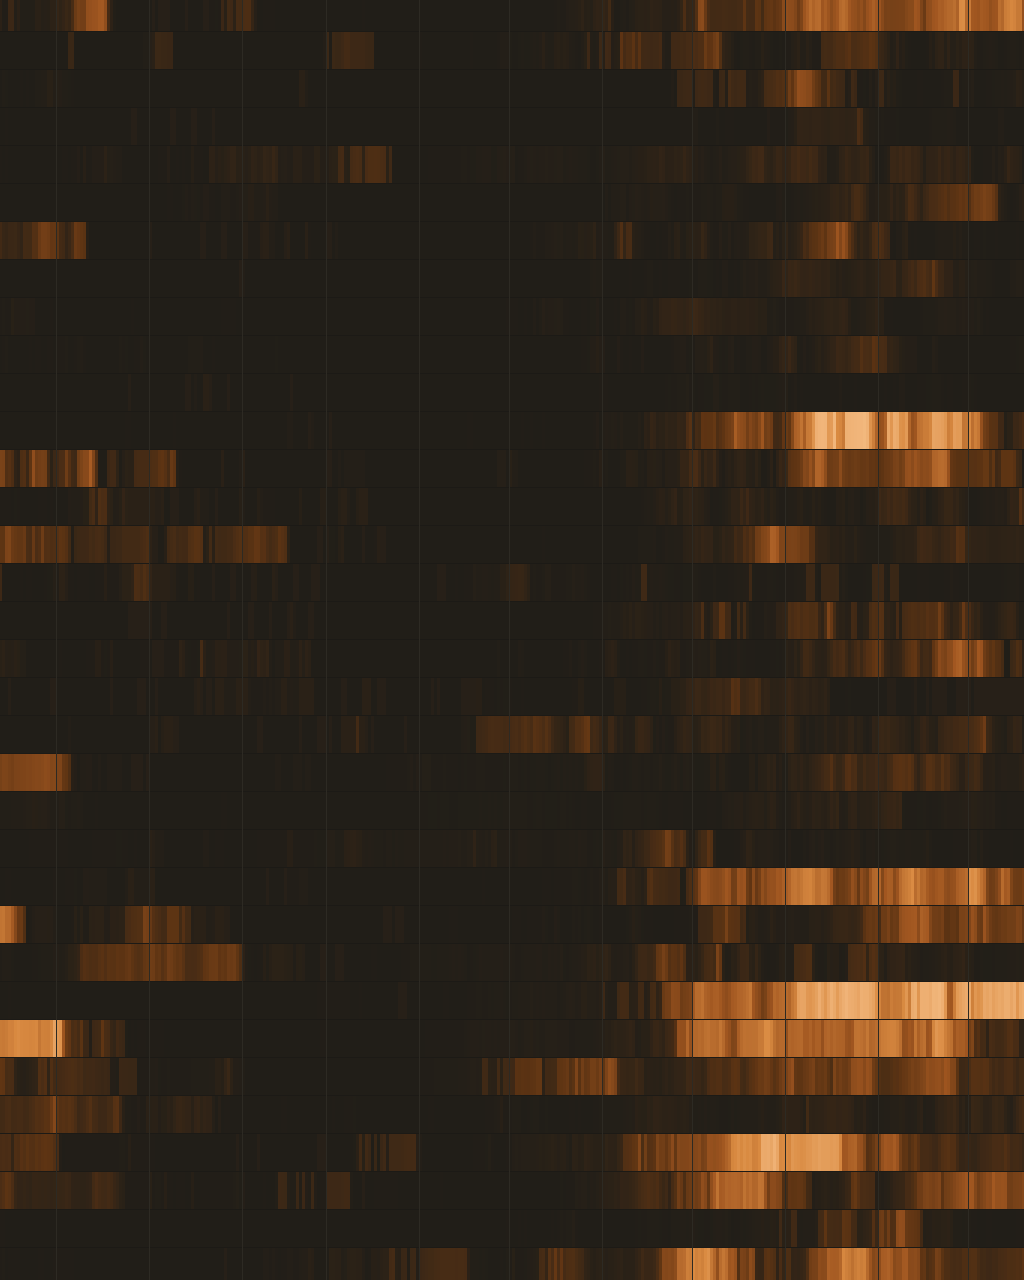
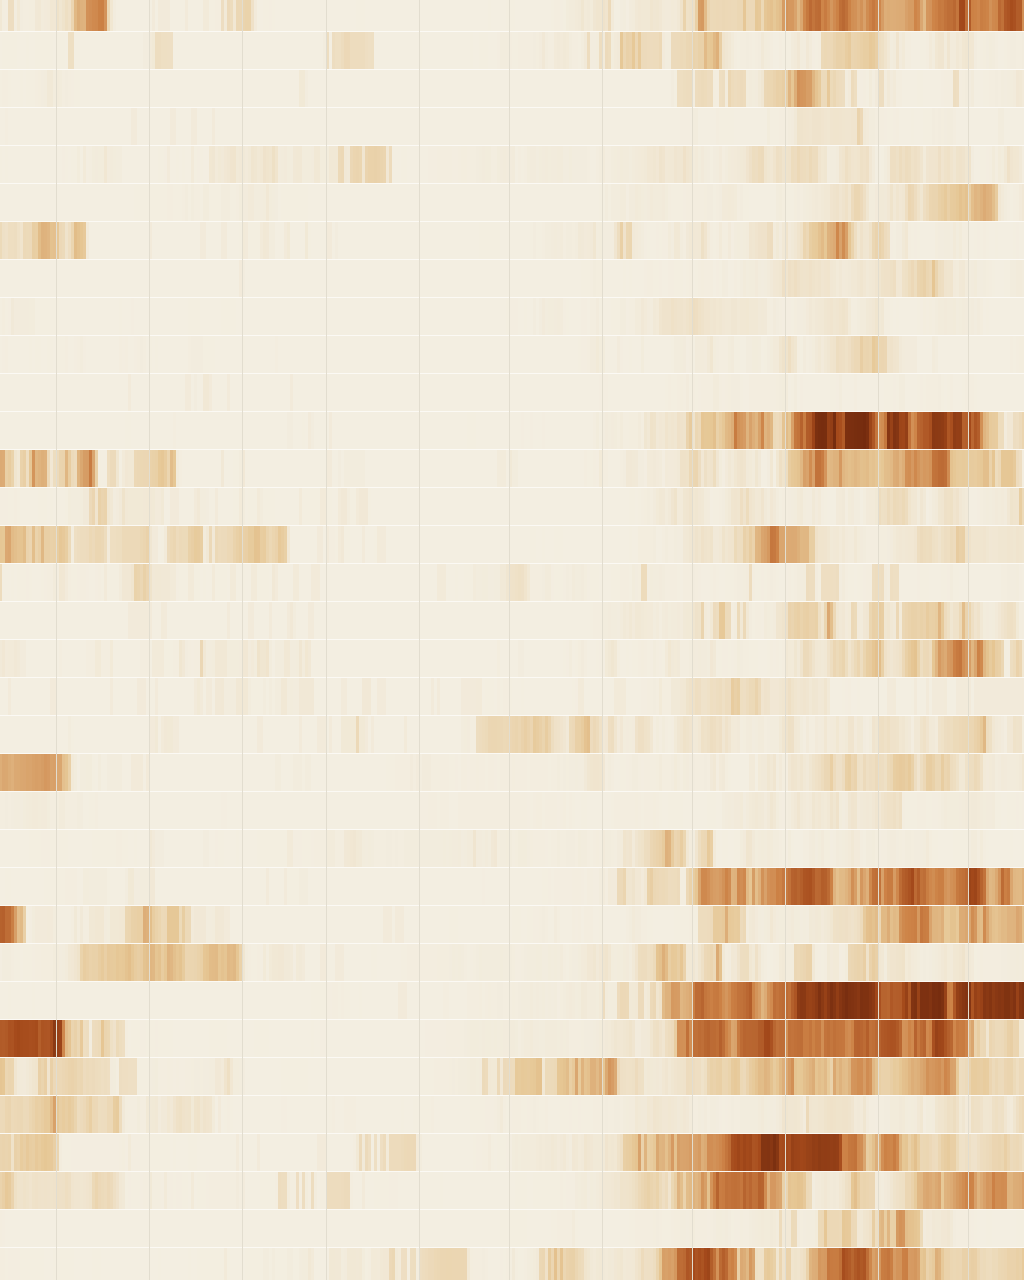
The median number of low-flow days per station-year has risen from five or six to 45. 224 of 359 gauges show a statistically significant upward trend. Even after correcting for multiple testing, 211 remain. The analysis shows the trend, not its cause.
Every number open for checking
The complete pipeline from raw data to the finished charts, the methodology documentation and the result files are all open. The raw data itself is fetched from the NIWIS interface on the first run.
View on GitHub ↗